
29th October 2012, 11:27 PM
|
|
Member
|
|
Join Date: Oct 2009
Posts: 451
|
|

Here you go gents for interest of some stats, sorry to get in the road michael, if you wish can get a mod to delete the post and i can put in another thread.
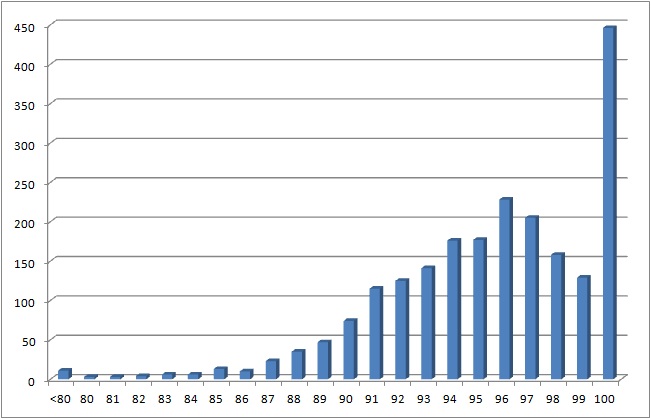
The following is a chart of the Unitab Ratings for all winners in races that i've completed my ratings on since 1 April 2012. In general these are races with greater then Class 3 rating:
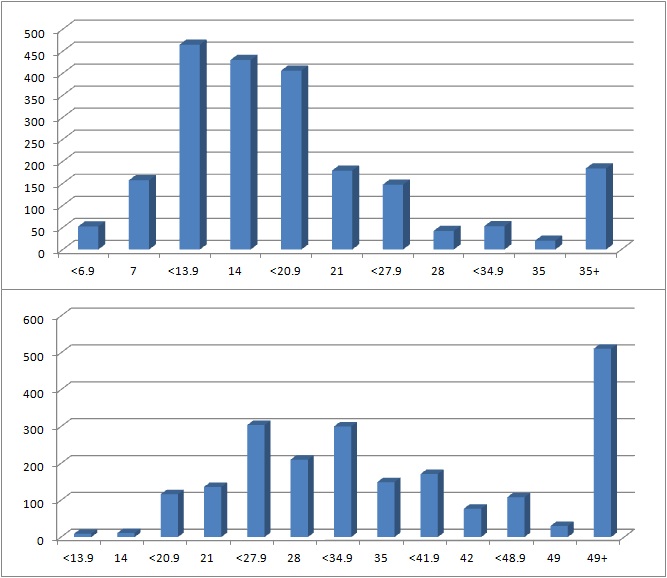
The following charts are firstly the stats for days since last start for all winners across the same time frame. It would seem 14 is the sweet spot as well as 6 days either side of this. The second chart is the days since second last start, and as the majority are 49+ it essentially shows that horses 2nd up seem to do the best.
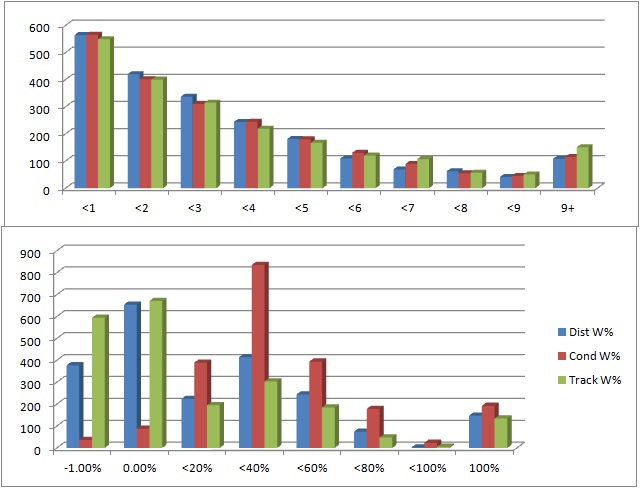
Finally the following 2 charts are as follows, the first chart is the lengths the winner of the race was behind the winner of its previous race (if that makes sense). The second chart is the stats based on a horses winning % in the conditions, track and distance. -1% means it hasn't ran in that element before. Essentially this shows that horses that have ran multiple times and won in the conditions have greater chance of winning again while its stats at the distance or track are negligible with quite a few winners never even running at the track/distance before.
Again sorry for clogging up thread, just figured these may be of interest for some. Obviously not a very large sample size (about 2066 races) but its a starting point.

|